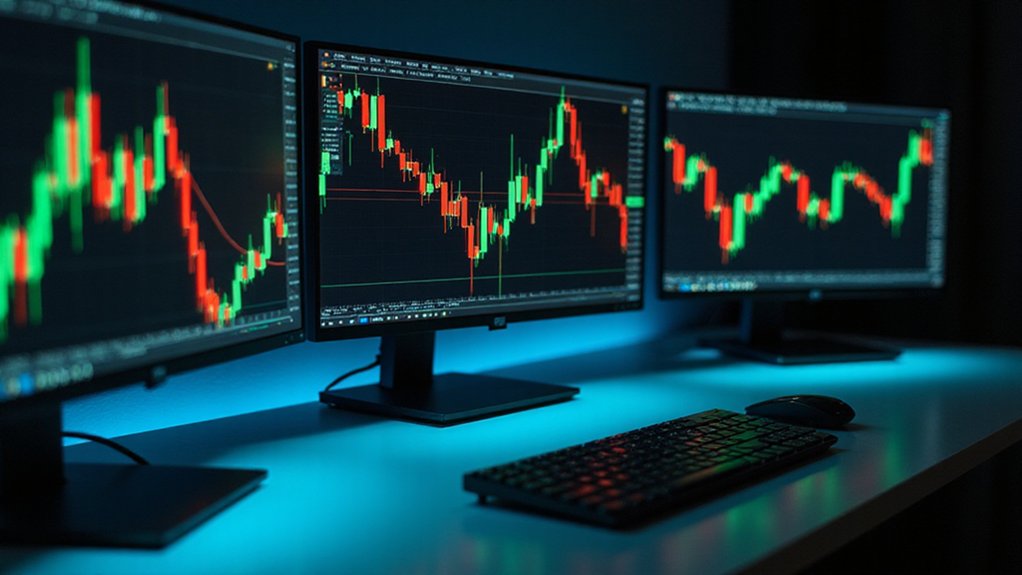
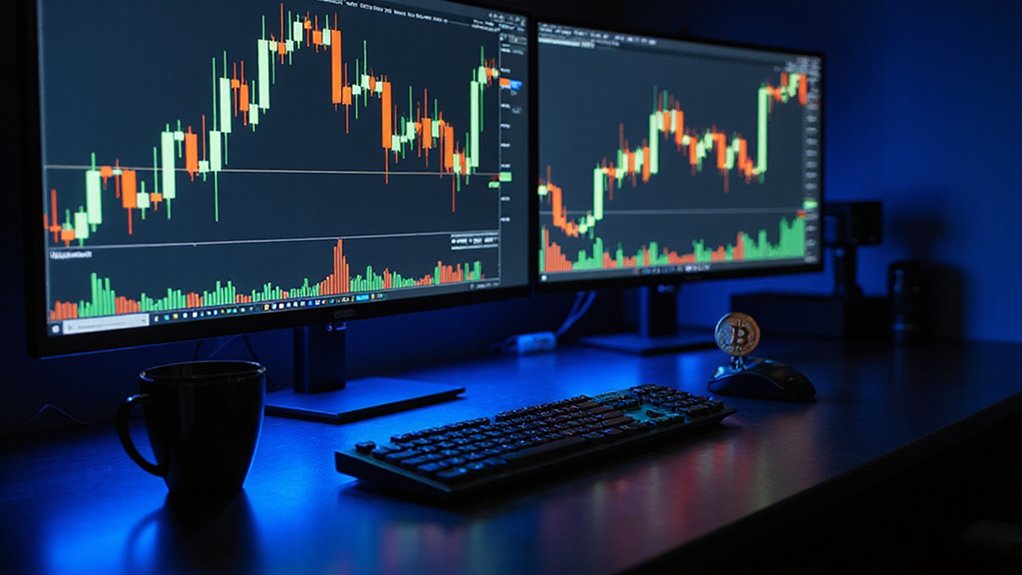
Candlesticks, the lingua franca of market analysis since their 18th-century Japanese rice trading origins, offer a concentrated narrative of price action through their anatomy. The rectangular body displays opening and closing prices, while wicks reveal price extremes. Green or white bodies signal bullish movements; red or black indicate bearish sentiment. Single patterns like hammers and dojis, plus multi-candle formations such as engulfing patterns and morning stars, reveal market psychology rather than predict outcomes. The subsequent patterns await those ready to decode market participants’ collective behavior.

Why do traders obsess over peculiar rectangular shapes with protruding lines when analyzing financial markets? These visual representations—candlesticks—have transcended their 18th-century Japanese rice trading origins to become the lingua franca of modern market analysis, offering a concentrated narrative of price action that bar charts simply cannot match.
The anatomy of a candlestick conveys a remarkably efficient data package: the rectangular body represents the opening and closing prices, while the extending “wicks” or “shadows” indicate the high and low extremes.
Color-coding (typically green/white for bullish movements; red/black for bearish ones) instantly communicates market sentiment. Understanding the price axis helps traders identify key support and resistance levels on candlestick charts.
A candle’s proportions speak volumes—long bodies suggest conviction; extended wicks indicate rejection of price extremes.
Single candlestick formations often presage significant market movements. The hammer—characterized by a small body and elongated lower wick—emerges from downtrends like a phoenix, signaling potential reversals. Its inverted cousin, the shooting star, warns of impending bearish turns after uptrends. Dojis, with their cross-like appearance, reveal markets in equipoise, traders collectively uncertain about direction.
More compelling still are multi-candle arrangements. The bullish engulfing pattern—where a green candle completely overtakes its predecessor’s trading range—often heralds upward momentum. Morning stars illuminate bottoms with their three-candle sequence, while evening stars forecast bearish reversals with equal reliability.
Continuation patterns like the rising three methods offer confirmation of existing trends, presenting small consolidation candles nestled within larger directional movements. These formations provide strategic entry points for traders looking to join established momentum.
The true virtuosity in candlestick interpretation emerges when incorporating volume analysis and timeframe alignment. Due to new UK rules, some popular trading education pages might be temporarily unavailable while platforms work on compliance. AltFINS provides comprehensive education on essential candlestick patterns that crypto traders can leverage for developing effective trading strategies. A pattern confirmed across multiple timeframes and accompanied by substantial trading volume carries substantially more weight than isolated formations.
For crypto traders handling notoriously volatile markets, candlestick analysis offers both warning system and opportunity detector—provided one remembers that these patterns reflect the psychology of market participants rather than mystical predictions. Success ultimately requires recognizing when the rectangular tea leaves align with broader market conditions.
Frequently Asked Questions
How Do Candlesticks Predict Future Price Movement?
Candlesticks don’t predict movements so much as reflect market psychology—the eternal tug-of-war between bulls and bears.
Through recognizable patterns (three white soldiers, hammers, engulfing formations), they offer statistical probabilities rather than certainties.
When combined with volume analysis, timeframe verification, and technical indicators like RSI or MACD, these formations become particularly potent signals.
The patterns, having repeated across centuries of trading (yes, since 18th century Japan), represent collective human behavior that—remarkably—remains consistent across markets and eras.
Can Candlestick Patterns Be Combined With Other Technical Indicators?
Candlestick patterns thrive when paired with complementary technical indicators, creating a veritable symphony of market signals.
Traders routinely combine engulfing patterns with RSI divergence, hammers with volume confirmation, or dojis with Bollinger Band squeezes to filter false signals.
The synergy between candlestick formations and momentum oscillators (MACD, Stochastics) can substantially improve prediction accuracy, while support/resistance levels transform ordinary patterns into high-probability trading opportunities—a delightful alchemy that turns pattern recognition from art to science.
How Reliable Are Candlestick Patterns in Crypto Trading?
Candlestick patterns in crypto trading operate at diminished reliability compared to traditional markets, with even established formations like Morning Stars achieving only ~65% success rates.
Cryptocurrency’s inherent volatility erodes pattern dependability, creating an environment where false signals proliferate.
Market-specific challenges—liquidity variations across exchanges, speculative trading psychology, and rapid price movements—necessitate supplementing candlestick analysis with confirmation techniques (LSTM networks, volume validation, and momentum indicators) to establish meaningful trading parameters rather than relying solely on pattern recognition.
Which Candlestick Patterns Are Most Accurate for Cryptocurrencies?
Among crypto’s volatile terrain, the most reliable candlestick patterns tend to be those offering clearest sentiment signals—Bullish and Bearish Engulfing patterns particularly shine when volume confirms their message.
The Morning Star and Evening Star formations, when appearing at established support or resistance levels, also demonstrate notable accuracy.
Hammers and Shooting Stars maintain respectable reliability, though their significance multiplies dramatically when accompanied by substantial trading volume and complementary technical indicators such as RSI or MACD divergences.
How Long Should I Practice Before Using Candlesticks for Real Trades?
There’s no universal timeline for candlestick proficiency—traders should practice until pattern recognition becomes second nature (a process that varies considerably between individuals).
Most experts recommend at least 3-6 months of consistent paper trading before risking capital.
The volatility of cryptocurrency markets demands particular diligence; successful traders typically log hundreds of hours analyzing historical charts and simulating trades before committing funds.
Mentorship can accelerate this learning curve substantially.


