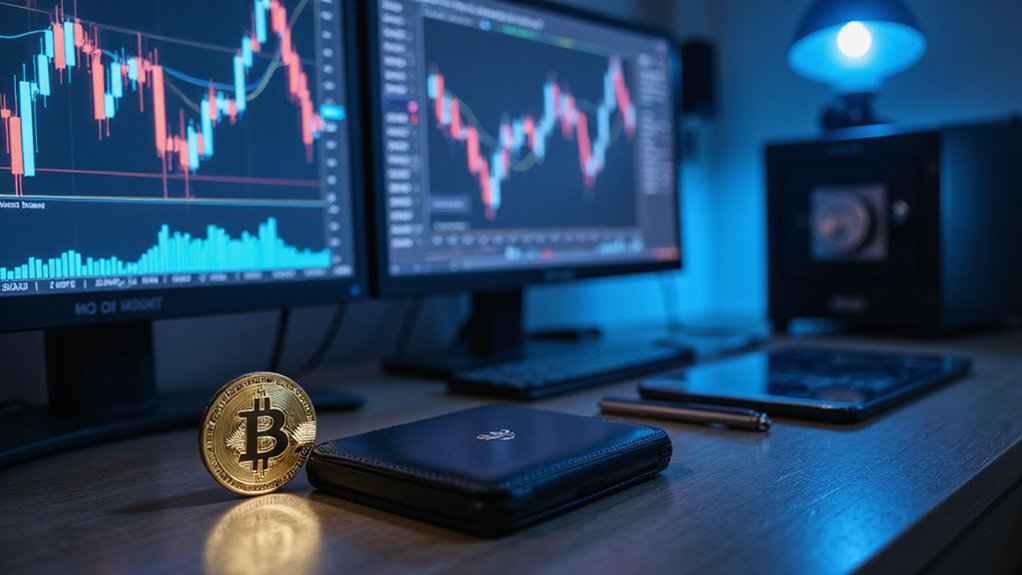

Cryptocurrency chart mastery begins with understanding candlesticks—green signaling price increases, red indicating declines—while paying attention to those telling wicks that suggest potential reversals. Volume serves as the conviction meter behind price movements; substantial shifts without corresponding volume warrant skepticism. Beginners should start with daily timeframes before venturing into noise-filled shorter intervals. Judicious application of technical indicators like RSI and moving averages helps identify trends, while recognizing common patterns provides probabilistic insights. The chart’s true power emerges when these elements converge into a coherent narrative.
Why do cryptocurrency charts—those cryptic arrangements of colored candles, zigzagging lines, and perplexing indicators—seem to function as a secret language accessible only to trading veterans? The reality is far less esoteric: these visual representations of market data follow consistent patterns that, once understood, reveal the psychological tug-of-war between buyers and sellers.
Candlesticks form the foundation of most crypto charts, with each “candle” encapsulating a temporal story of price movement. Green bodies indicate price appreciation (open at bottom, close at top), while red signals decline.
The protruding wicks show the extreme highs and lows reached during that timeframe—long wicks often suggest a rejection of price extremes, potentially foreshadowing reversals. When these candles compress into diminutive dojis, the market broadcasts its indecision.
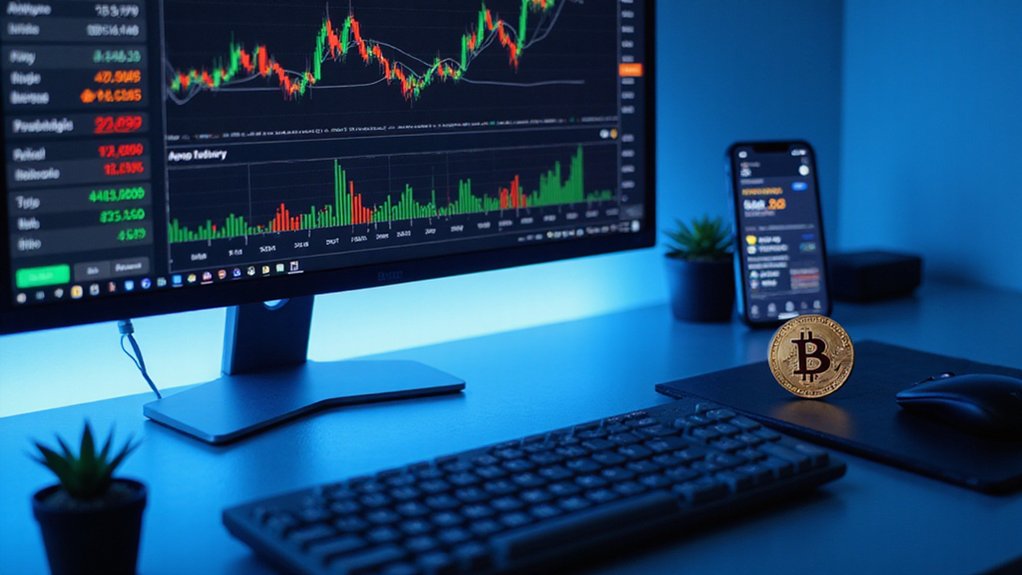
Behind every price movement lurks volume—perhaps the most overlooked yet vital component. Substantial price shifts occurring on minimal volume should raise eyebrows; conversely, price moves accompanied by volume surges generally carry more conviction. The astute observer recognizes that price without volume context is merely half the story.
Volume is the heartbeat beneath price action—a market’s conviction meter that separates meaningful movements from mere noise.
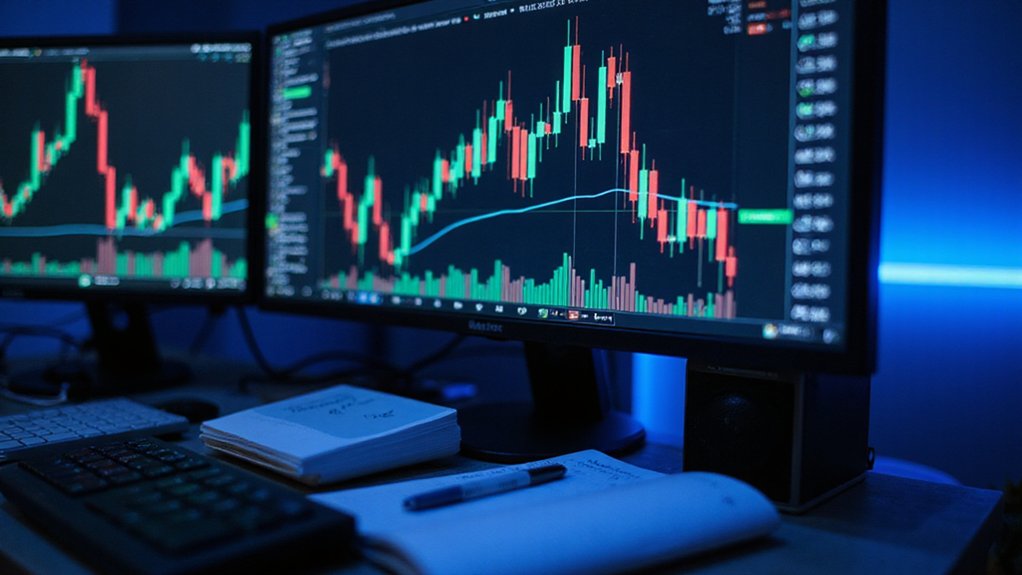
Timeframes matter immensely. Daily charts reveal the forest; minute-by-minute views show individual trees (and occasionally, mere twigs).
Beginners would do well to start with daily views before venturing into the noise-filled domain of shorter intervals. Multiple timeframe analysis—examining both macro and micro perspectives—often yields the most reliable signals.
Technical indicators add analytical layers but should be used judiciously. The RSI identifies overbought or oversold conditions; moving averages smooth price action to highlight underlying trends; while Bollinger Bands map volatility boundaries. Understanding these patterns becomes particularly valuable during a bull or bear market as they help identify sustained trends in either direction.
Traders typically classify patterns into two major categories: continuation patterns like flags, pennants, and triangles that suggest the current trend will persist, and reversal patterns that indicate potential direction changes. Recognizing engulfing patterns can be crucial for identifying potential market reversals when a larger candle completely overtakes the previous one.
The cardinal sin of chart analysis: indicator overload—littering one’s screen with contradictory signals virtually guarantees analysis paralysis.
The most common mistake new chartists make isn’t misreading patterns but rather neglecting risk management. A flawless technical setup means nothing without appropriate position sizing and predetermined exit strategies. Charts may suggest possibilities, but prudent traders remember they offer probabilities, not prophecies.
Frequently Asked Questions
Which Trading Platforms Have the Most User-Friendly Cryptocurrency Charts?
For novice traders exploring the cryptosphere, Coinbase offers the most beginner-friendly charts with its intuitive interface and educational rewards program.
eToro follows closely, distinguishing itself through social trading overlays and virtual portfolios that eliminate financial risk.
Crypto.com’s mobile-first approach appeals to on-the-go investors, while Kraken—though feature-rich—caters more to experienced traders through its Kraken Pro platform with advanced customization options (impressive, albeit potentially overwhelming for newcomers).
Do Chart Patterns Work Differently for Altcoins Versus Bitcoin?
Chart patterns function similarly across cryptocurrencies but manifest with notable differences.
Bitcoin’s relative stability produces more reliable, textbook patterns—akin to reading established constellations in a clear night sky.
Altcoins, with their heightened volatility and susceptibility to market manipulation, often display the same technical formations but with exaggerated movements and false signals.
The fundamental principles remain consistent, yet interpreting patterns in altcoins demands greater skepticism and confirmation through multiple indicators.
How Often Should Beginners Check Cryptocurrency Charts?
Beginners should resist the urge to obsessively monitor cryptocurrency charts—a practice almost guaranteed to trigger emotional decision-making.
For those still finding their footing, daily checks using 4-hour or daily timeframes provide sufficient market visibility without drowning in volatility noise.
Scheduling three predetermined reviews daily (rather than compulsively updating) allows for pattern recognition while maintaining psychological equilibrium.
As trading competence develops, monitoring frequency can adjust to match one’s strategy, volatility conditions, and—crucially—mental fortitude.
Can I Use Traditional Stock Market Indicators for Cryptocurrency Trading?
Traditional stock market indicators can indeed be applied to cryptocurrency trading, albeit with essential adjustments.
While tools like RSI, moving averages, and Bollinger Bands function across both domains, crypto’s heightened volatility, 24/7 trading cycles, and regulatory vulnerability necessitate calibration.
The prudent trader recognizes that these indicators’ effectiveness hinges on volatility-adjusted parameters and supplemental considerations of crypto-specific factors—adoption trends, regulatory shifts, and the peculiar liquidity characteristics that distinguish this nascent asset class from traditional equities.
What Timeframes Are Best for Beginners Analyzing Cryptocurrency Charts?
Beginners in cryptocurrency trading would be well-advised to start with daily and 4-hour timeframes, which offer a prudent balance between clarity and noise reduction.
These higher intervals—mercifully free of the minute-to-minute volatility that has shattered many a novice’s confidence—reveal substantive market trends without the distracting ephemera of shorter periods.
As traders develop proficiency, they might gradually incorporate hourly charts, establishing a multi-timeframe approach that contextualizes short-term movements within broader market narratives.